Want a chance at increasing revenue by 42%? Here’s something to try…
But first, the backstory:
Many nonprofits already know the value of giving concrete examples for what donations of different amounts are worth. You know, things like…$25 feeds a shelter dog for three weeks…$60 pays for a counseling session at the legal aid clinic…$100 provides five hours of tutoring help…
Whether people donate and how much is greatly influenced by how we ask. Examples like these increase donor response because they paint a clear picture of the impact you can have if you give.
Typically, you see one gift amount connected to one action and the next gift amount connected to another, completely different action. For example, $25 feeds a dog for three weeks, $50 pays for vaccinating a dog, and so on.
So, what has more impact? Should you give $50 instead of $25 to vaccinate the dog instead of feeding it? As a donor, how are you supposed to know what has a greater impact? Are you making a bigger difference helping with vaccinations instead of food just because the donation amount is higher?
DonorVoice, a group focused on the donor experience in fundraising, set out to learn what would happen if these kind of giving levels were scalable and easier to compare.
Using my example above, scalable giving options might be something like…$25 feeds a shelter dog for three weeks, $50 feeds a shelter dog for six weeks, $100 feeds a shelter dog for three months, and so on…
In DonorVoice’s study, they tested two different giving pages created for The UN Refugee Agency (UNHCR).
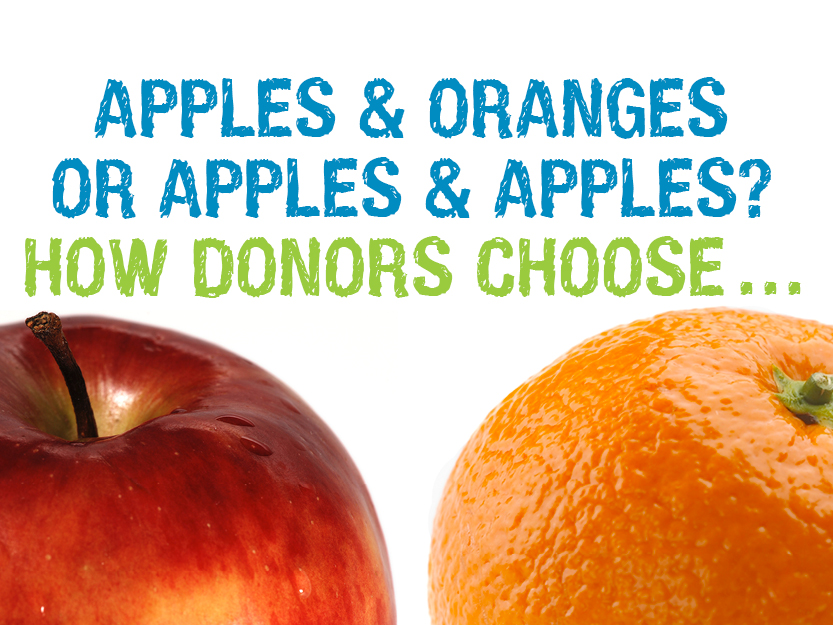
One was their usual page featuring traditional gift options where items are unrelated to each other, which DonorVoice calls asymmetric options (which we can think of as apples & oranges). This page was the control. The other page tested the effectiveness of scalable gift levels, which they call symmetric options (which we can think of as apples & apples).
Here are the results, as explained by Dr. Kiki Koutmeridou, behavioral science strategist at DonorVoice:
“The symmetrical test page yielded $12,820 in total revenue while the control only $9,005. These results were due to an increase in the revenue per donor. The control page resulted in $83 per donor while the symmetrical test page yielded $111 rev per donor.”
That’s a 42% increase in revenue. And all they did was change the way giving levels were presented.
Give it a try yourself and see how it affects your fundraising results.
P.S. Starting next week, I’m running a three-part series on Donor Commitment (assessing it, increasing it) here at the Funding Change blog. To make sure you don’t miss an installment, subscribe or follow me on Twitter!
Tina Cincotti, owner of Funding Change, is a donor communications expert and general nonprofit nerd.
July 24, 2018


Good one, Tina! Pizza forever!
So valuable, Tina. Tyou
Excellent. Thanks! Did this work with donors of all levels? And sustainers too? By mobile request as well as email? Thanks again. Margie PS Missed you at GIFT/Money for Our Movements.
Hi Marjorie–here’s the link to the original study write-up. Kiki can likely answer questions that aren’t addressed in the article. http://www.thedonorvoice.com/what-your-donation-buys-how-to-get-a-43-lift-in-revenue/